

Aftershow
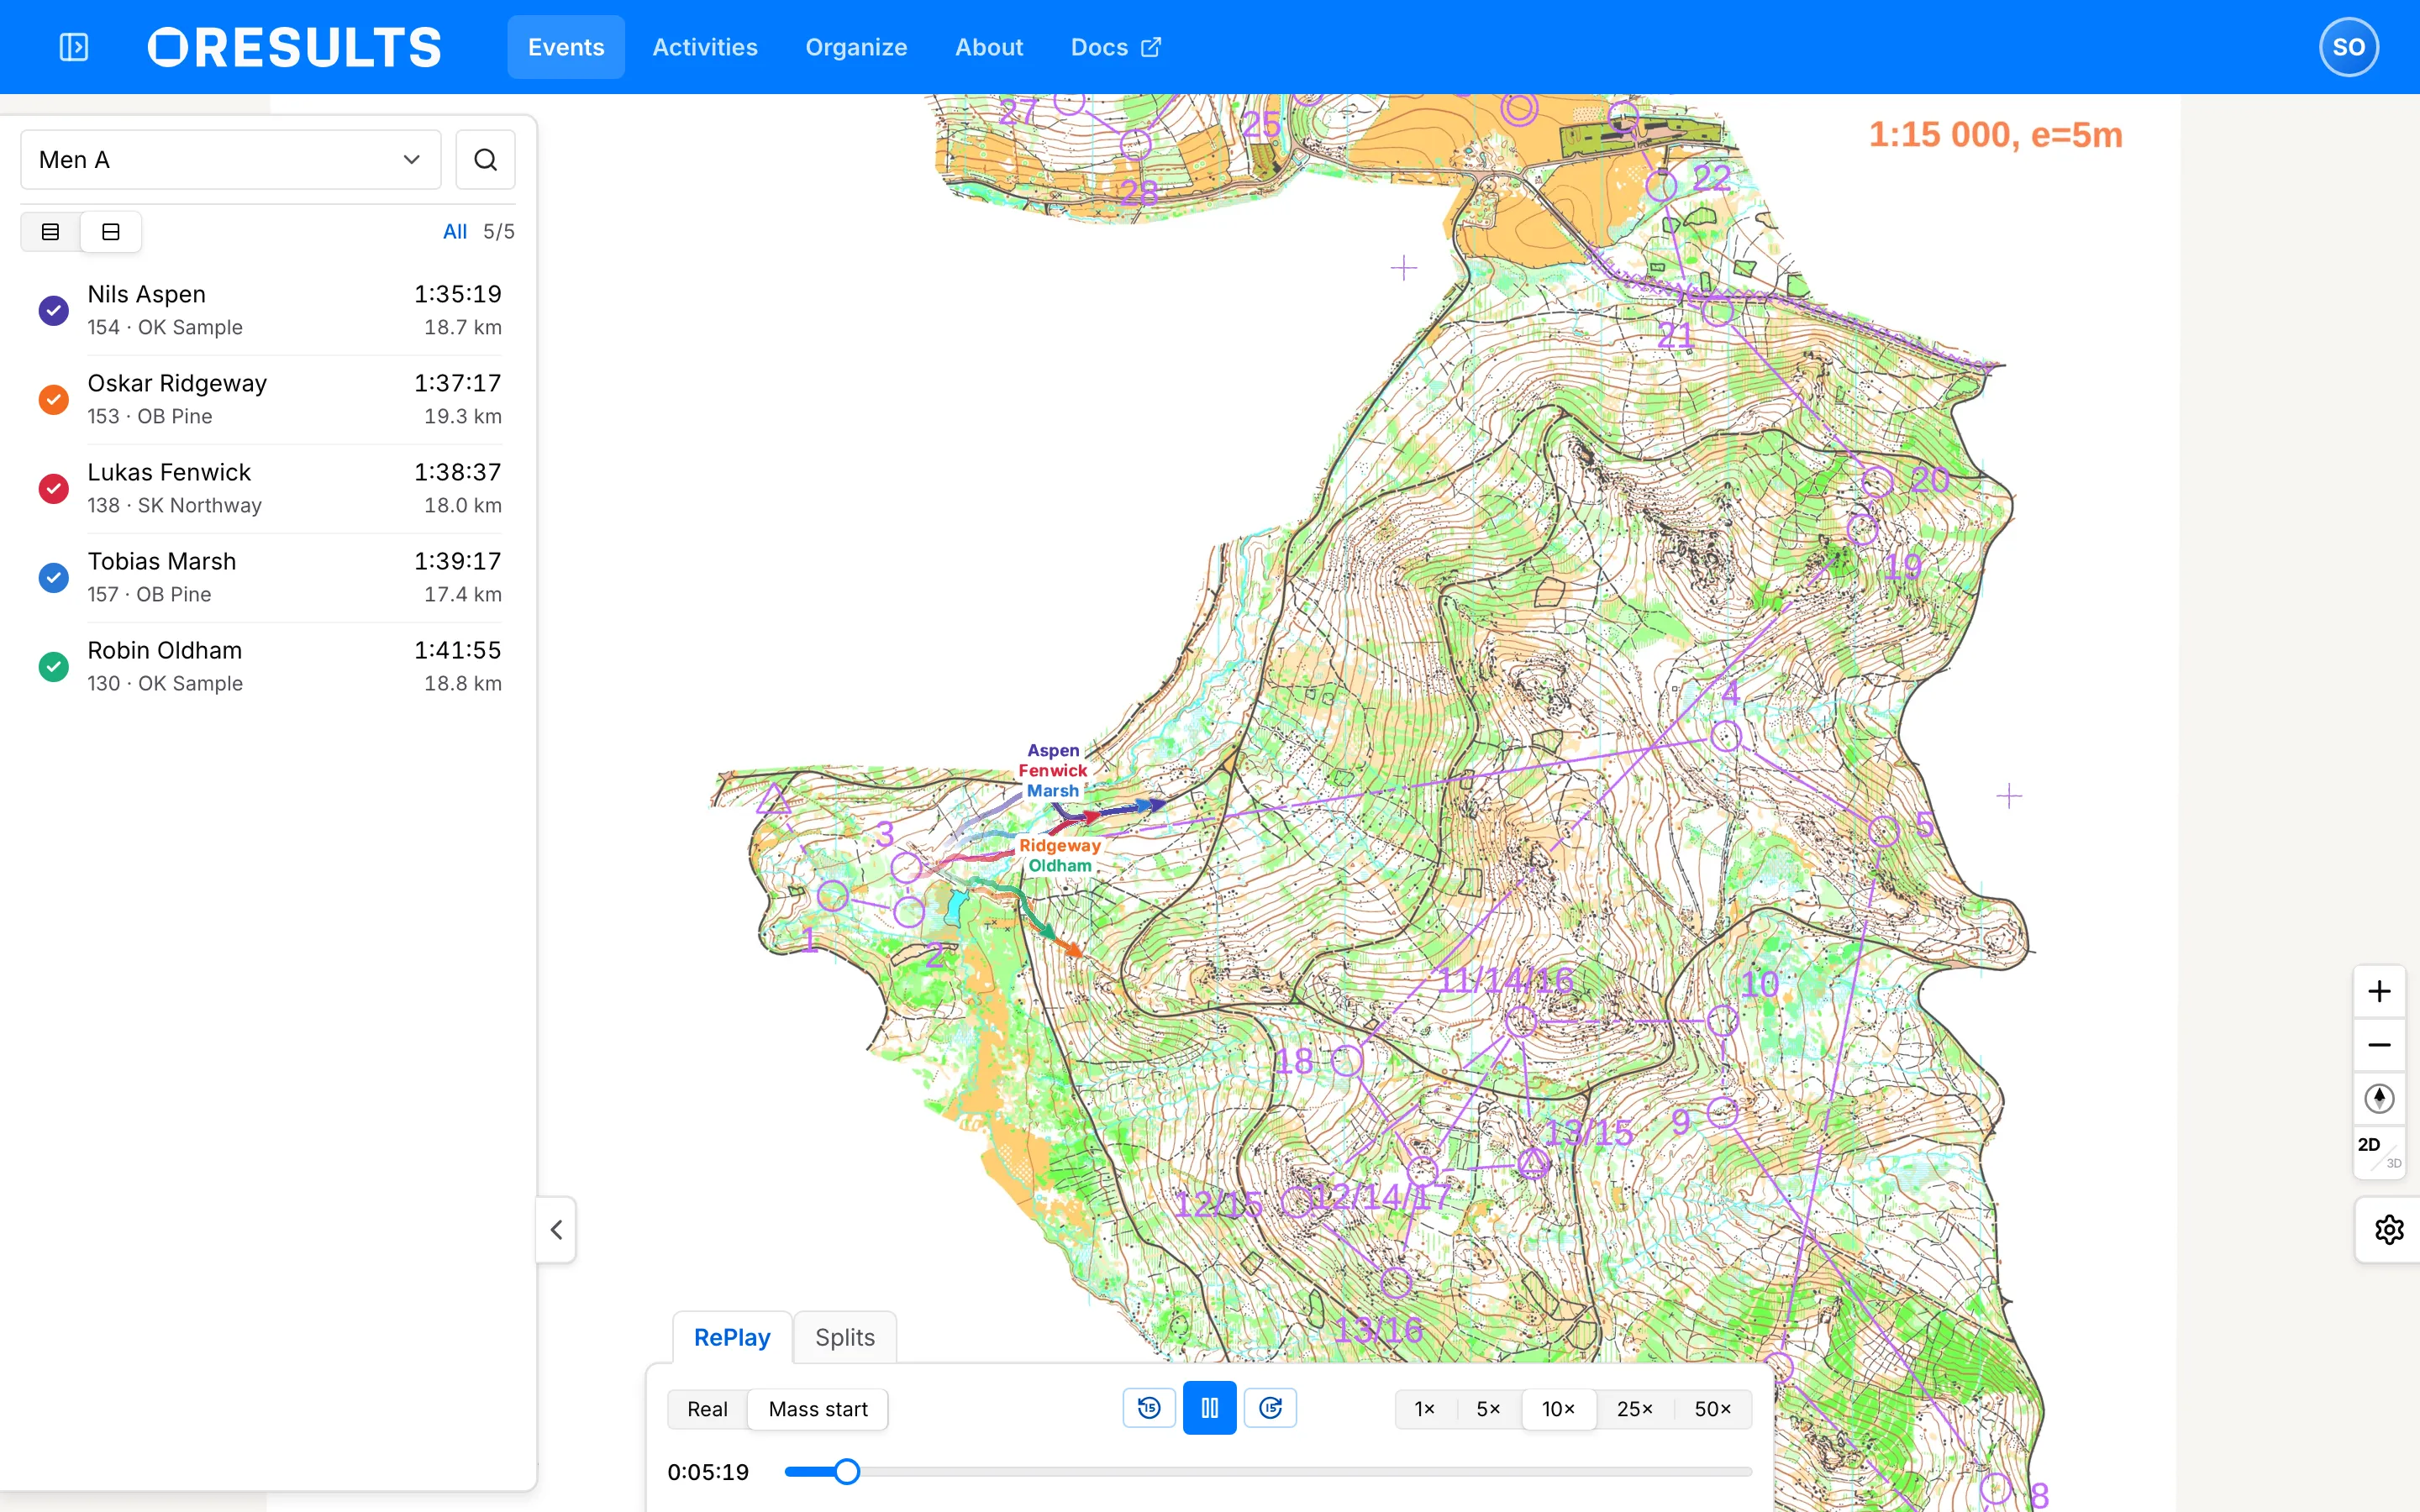
The Aftershow is what an event offers once the running is done: every runner’s GPS track drawn over the event’s own map, so a race you read as a column of times can be watched as it happened. It is a view of its own in the event’s menu, beside Results, and it has two tabs — RePlay animates the whole field across the terrain, and Splits cuts the same tracks control by control and ranks them. The two share one map, one class and one set of runners, so moving between them never loses your place.
Opening the Aftershow
Section titled “Opening the Aftershow”Open the event and select Aftershow in the event’s menu. What that row says is what the replay is doing — open, scheduled for a moment still to come, or not published at all. Following an event reads the row.
The Aftershow lands on RePlay, carrying the class you were reading across — see Keep the class when you switch views on the Reading the results page.
Choosing who you watch
Section titled “Choosing who you watch”The runner panel grows from the map’s left edge. The toggle on its outer edge closes it and gives the map the whole viewport, and while it is closed that toggle carries the class you are watching beside it, so you always know what is on the map.
Pick the class at the top of the panel. Each entry in the list carries how many tracks it has and what the course is — 8 tracks · 15.2 km, 31 controls, or No tracks yet for a class nobody has connected a track to. Past twelve classes the open list grows a Filter classes field. On a relay event a class is one row with its legs as numbered chips beside it; select the chip for the relay leg you want.
The magnifier beside the class picker searches the runners you are looking at, by Name, bib or club.
Every runner in the class has a row, and the row does two separate things:
- The colored circle on the left draws that runner on the map or takes them off it. The counter above the list reads how many of the class are drawn out of how many there are, and All shows or hides everyone currently listed.
- Selecting the rest of the row selects the runner. Selected runners stay at full strength while everyone else on the map dims, which is how you follow two or three people through a crowded field. A chip beside the counter counts the selection and clears it, and changing class clears it too.
The two buttons on the left of that same divider switch the rows between one line and two. A class with nothing to show says No GPS tracks yet, and explains that runners appear as soon as their trackers or uploaded activities arrive.
RePlay
Section titled “RePlay”The console under the map is the transport: play and pause, a step back and forward of 15 seconds, a speed of 1×, 5×, 10×, 25× or 50×, and below them the clock and a scrubber you can drag to any moment of the race.
Real and Mass start decide what that clock means. Real is the time of day, with each runner setting off at the start time they actually had. Mass start re-bases everyone onto the course start so the whole field leaves together at zero, which is the only way to compare runners who ran hours apart. A finished event opens on Mass start for exactly that reason; an event still running opens on Real time, because there the story is what is happening now. The toggle needs a located start on the course — without one it is inert and says No located start on this course.
While live data is still arriving, a Live chip sits at the end of the scrubber and pins playback to the live edge; speed is fixed there, and the chip is unavailable in mass start and gone once the stream has ended.
The map
Section titled “The map”The Aftershow draws on the event’s own map where the organizer rendered one. Without a base map it replays the tracks over a plain street map, with no course drawn — see Uploading event files.
The buttons on the map’s right edge are the camera. Zoom in and out; the compass needle points at the map’s own north lines rather than true north, and Back to map north swings the camera back to them — once the map is straight but still tilted, the same button becomes Level the map. The 2D / 3D switch drapes the map over the terrain and tilts the camera; the mode it is in is the larger of the two labels.
The gear below them opens the settings panel, in three sections:
- RePlay — Tail length, the trail each runner drags behind their head, from None through 1 min and 5 min to ∞. It starts at two minutes, and the section is dimmed while you are on Splits.
- Visibility — how strongly the Map, the Course and the Tracks are painted, each from Hide to Full. Course is offered only where the course is drawn from its control coordinates; a course that arrived as an OCAD overprint is printed into the map itself and moves with the Map slider.
- Sizes — the width of every track line, and the size of the runner Heads and their name Labels.
Reset all settings puts all of them back. The settings are remembered in your browser and apply to every replay you open there.
Splits
Section titled “Splits”Splits cuts every drawn runner’s track at the controls and ranks the pieces. In place of the transport its console carries the leg strip: one chip per control, S first and F last. Selecting a chip picks the control-to-control leg that ends at it, and the leg’s two chips merge into one pill; the arrows at either end step to the previous or next leg.
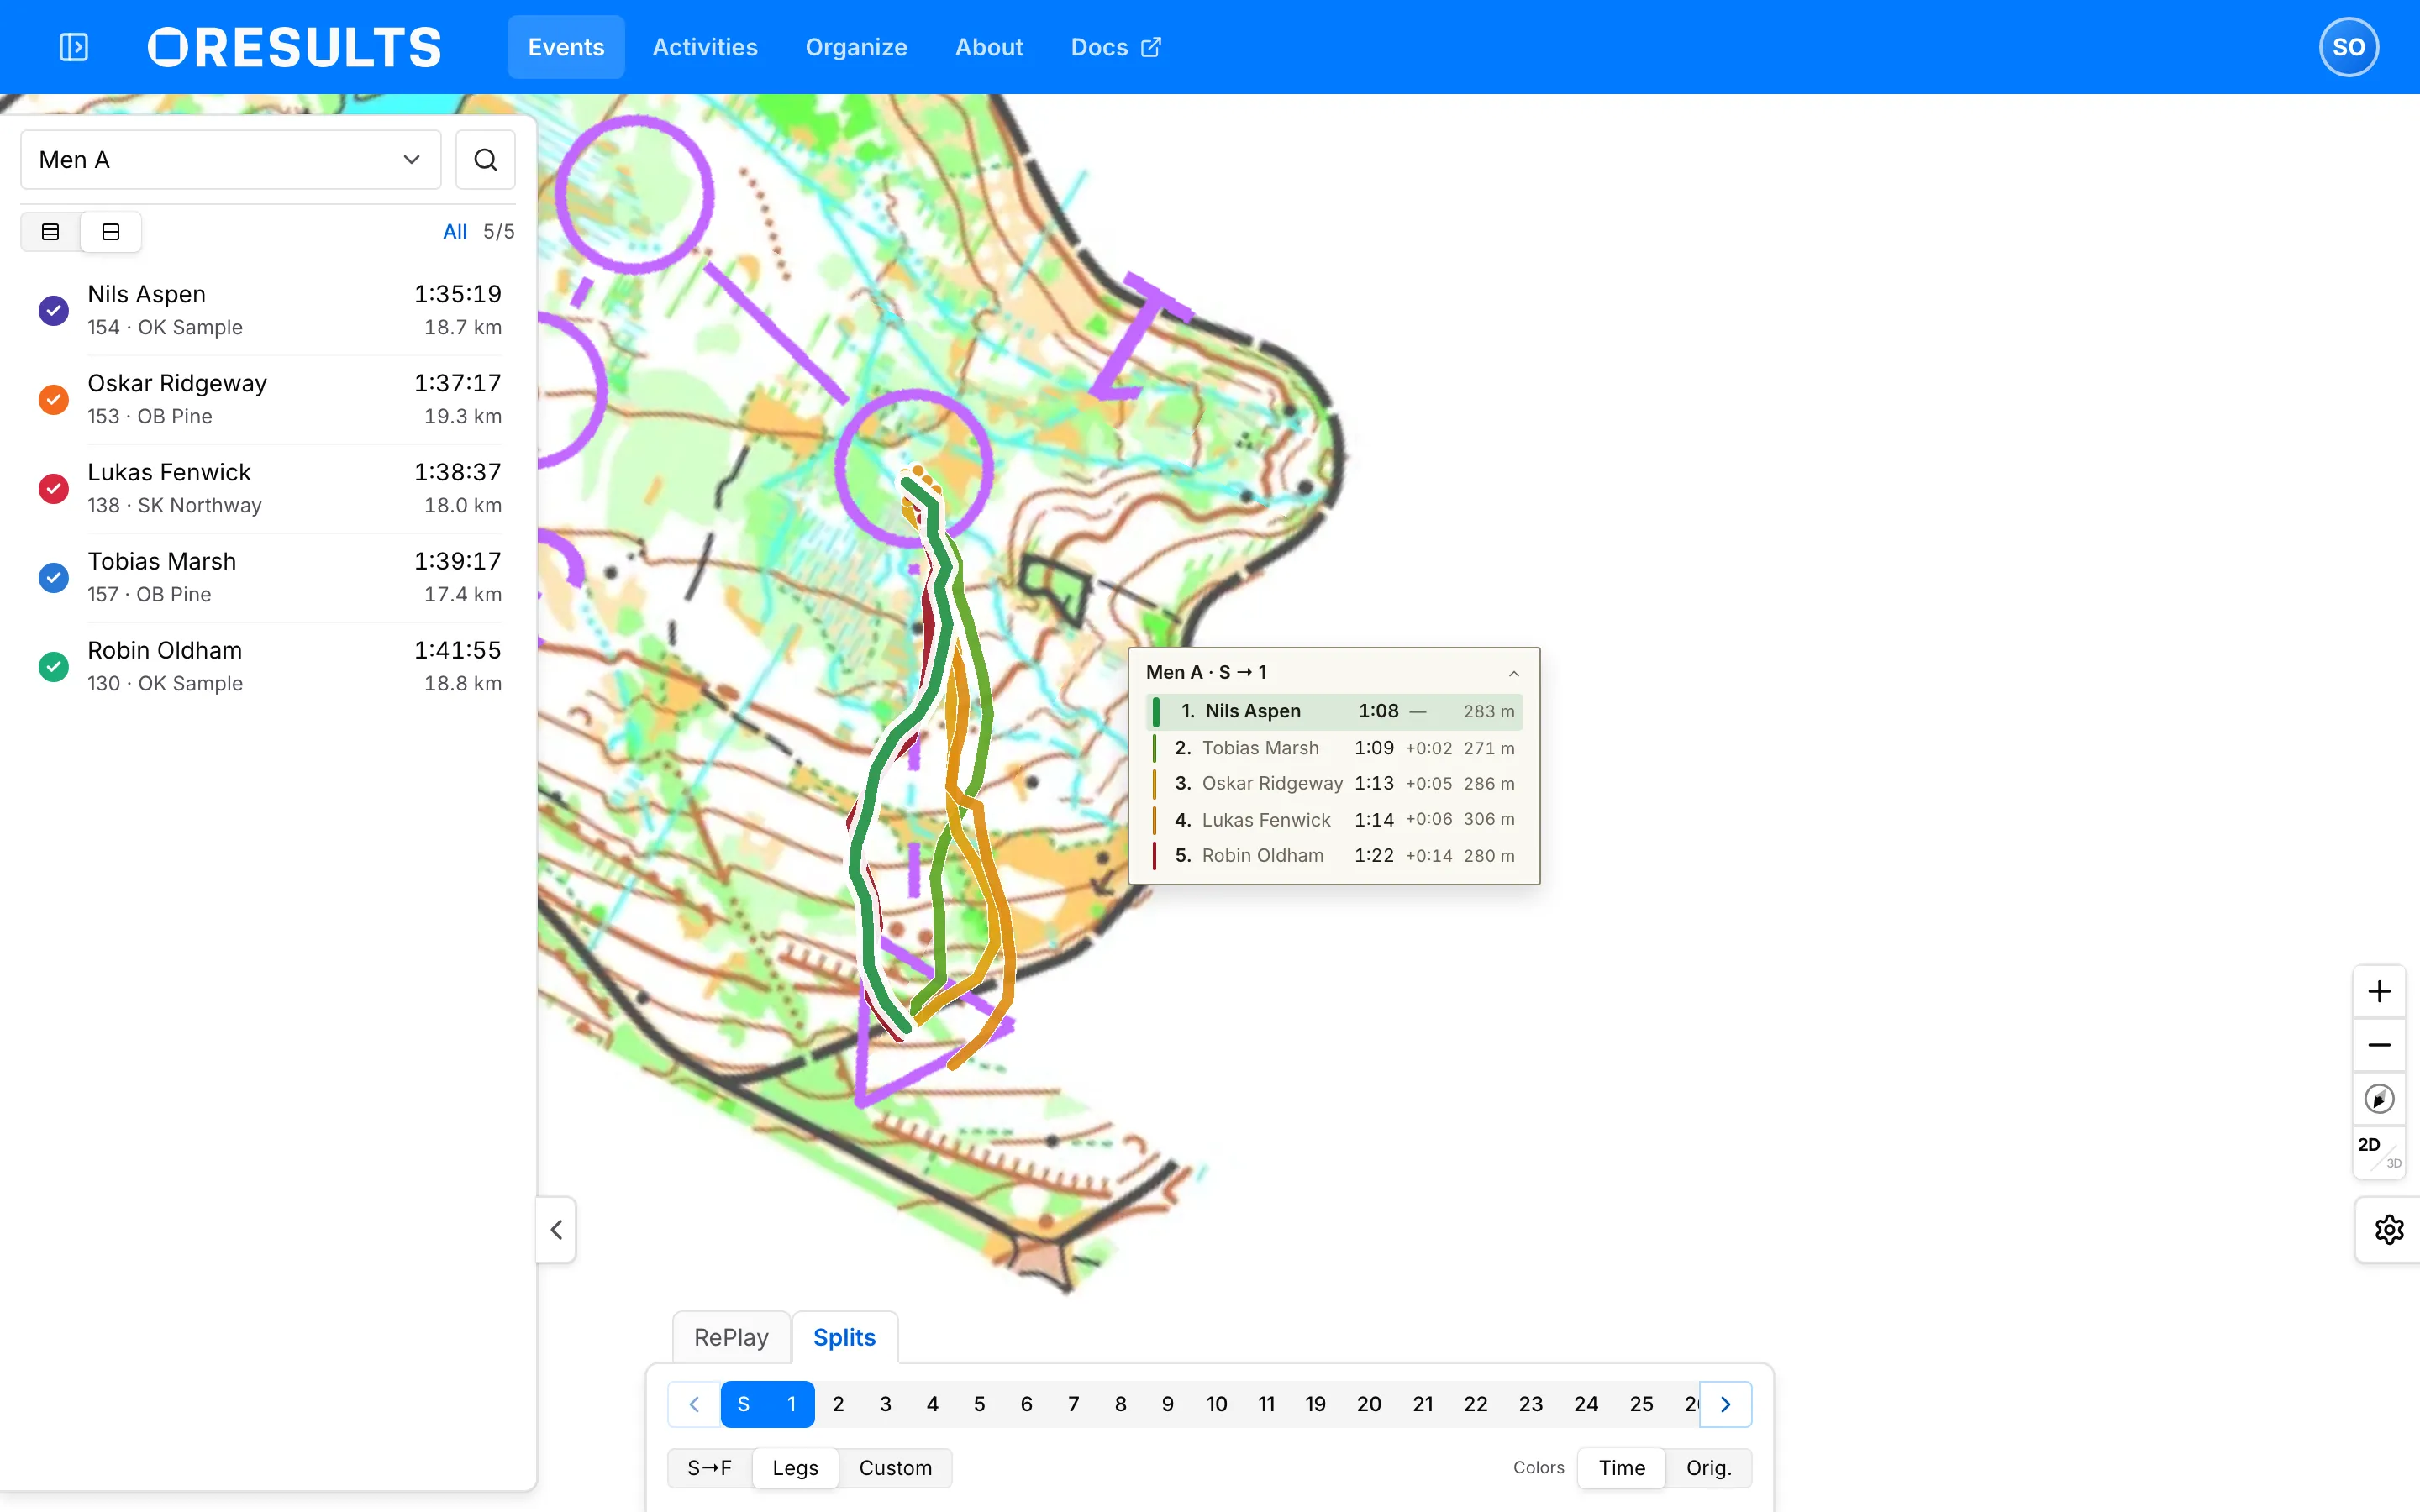
The three buttons below the strip choose what is being measured:
- S→F takes the whole course as one window, so each runner’s time is their total and each route is the whole run.
- Legs is the strip above.
- Custom measures between two points you pick on the map instead of two controls. The console walks you through it — Tap the map — place the split start, then Start set — now tap the split end — and each drawn runner’s fastest passage between the two is ranked like a leg. A pair no track comes near answers No tracks pass within 35 m of both points., and Clear starts the pick again.
Colors decides how the routes are painted. Time puts them on one gradient from the fastest split to the slowest, so the map itself reads as the ranking; Orig. keeps each runner’s own color from RePlay, which is what you want when you are following named people rather than a spread. Where a runner was still on the leg after the fastest split had already elapsed, that last part of their route is drawn dotted — the ground they lost.
The standings board floats beside the routes it ranks. Its header names the selection — Men A · S → 1 — and folds the card; the rows read rank, name, split time, the gap behind the fastest, and the distance that runner actually covered, fastest first. Runners the split has no time for close the list under no time. Hovering a row outlines it and lifts that runner’s route above the others; selecting the row pins it there. A ranking taller than the card ends in Show all.
Keyboard shortcuts
Section titled “Keyboard shortcuts”On a computer the whole view is driveable from the keyboard. The same legend sits at the foot of the settings panel.
| Key | Does |
|---|---|
| space | Play or pause |
| ← → | Skip 15 seconds back or forward on RePlay; previous or next leg on Splits |
| ↑ ↓ | Step the playback speed up or down |
| 1 2 | Switch to RePlay or to Splits |
| / | Open the runner search |
| esc | Close the open panel |
Where the tracks come from
Section titled “Where the tracks come from”A runner appears in the Aftershow because a GPS track was attached to them — a tracker the organizer issued for the race, or a recording the runner uploaded and connected to the event themselves. See Your activities for uploading a run and connecting it.
For organizers
Section titled “For organizers”Publishing the Aftershow, now or on a schedule, is on the event editor’s Event & Access page — see Set up an event. The terrain it draws on and the course over it come from the base map and the course file — see Uploading event files.